How to integrate GDBFrontend with your Makefile?
Written by Meowing Cat on 2/1/2022, 3:00:00 AM
Learn how to integrate GDBFrontend with your Makefile
Hello, Cat is here! Today we are going to learn how to integrate GDBFrontend with your Makefile.
GDBFrontend has very powerful APIs on different protocols that allow you to extend and integrate your debugger into very large scale of possibilities.
First think you start your debugger:
gdbfrontendIf you are not specifying a port, the default port is 5550.
You can specify the port with -p PORT parameter.
If you want to start multiple GDBFrontend sessions, you should specify different ports and terminal IDs for each debugger.
Just like:
gdbfrontend # debugger one, default port: 5550 and default terminal ID: gdb-frontend
gdbfrontend -p 5551 -t gdb-frontend-2 # second debugger
Load the executable to debugger
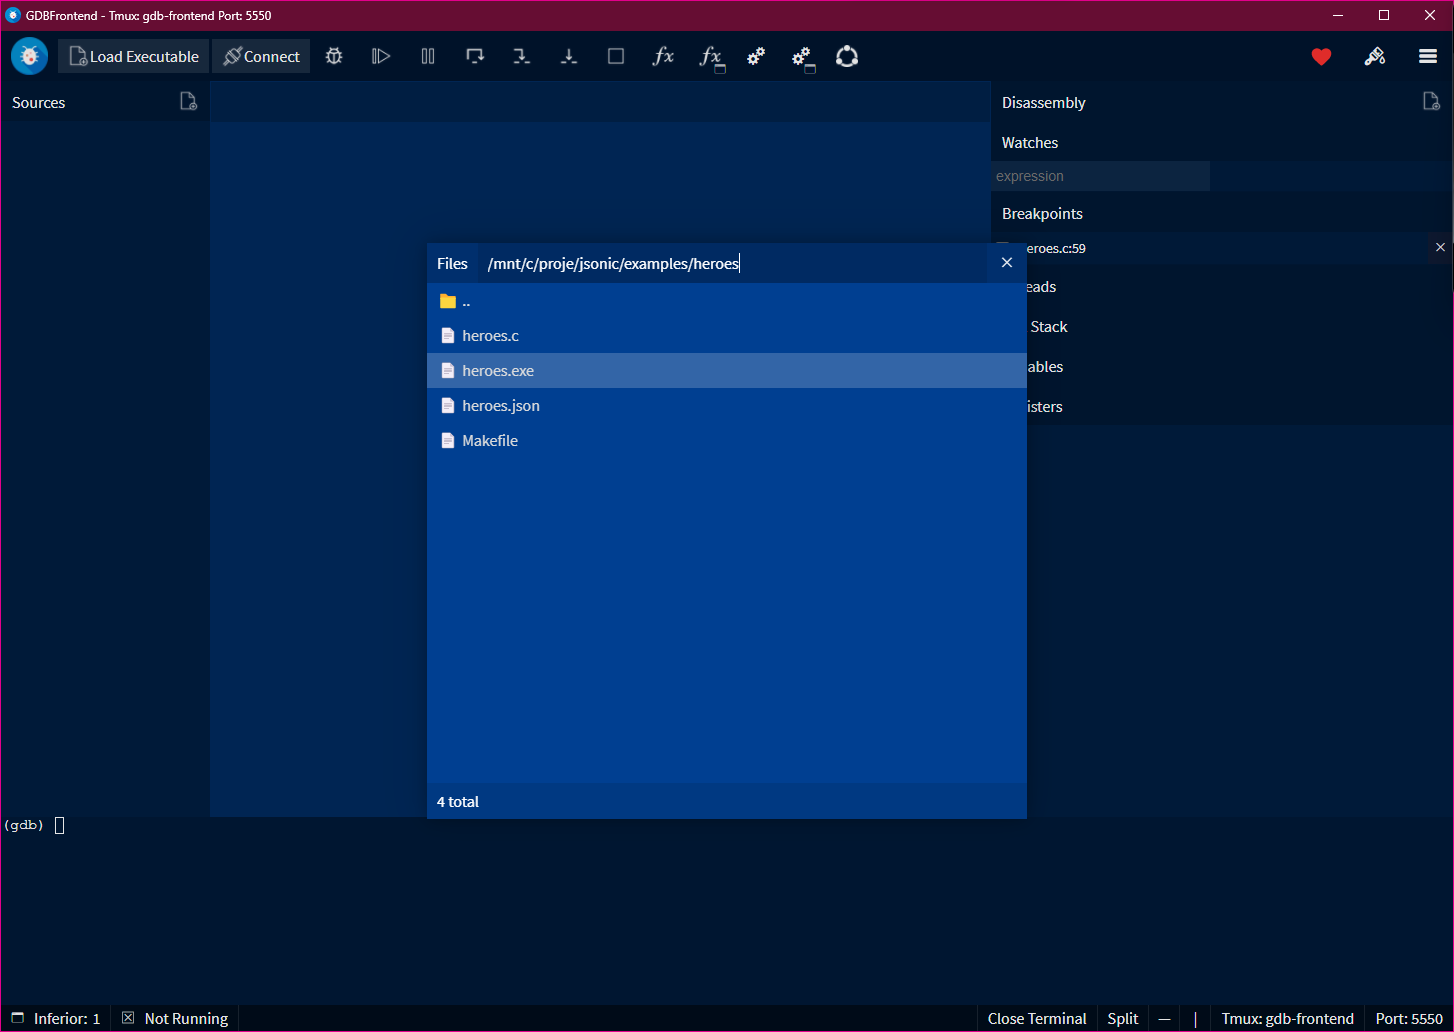
When we load the executable, it will reload it when you re-build it.
Just click to Load Executable button on top left side.
Let’s add a debug recipe to call GDBFrontend HTTP API
We are going to use GDBFrontend’s HTTP API in our Makefile.
We should send a request to this:
curl http://127.0.0.1:5550/api/runtime/runBefore integration, the Makefile looks like this:
CC = gcc
CFLAGS = -std=c99 -I../../ -O3 -g
JSONIC_SOURCES = $(filter-out $(shell find ../../ -path "*/examples/*"), $(shell find ../../ -name "*.c"))
JSONIC_HEADERS = $(filter-out $(shell find ../../ -path "*/examples/*"), $(shell find ../../ -name "*.h"))
JSONIC_OBJ = $(JSONIC_SOURCES:.c=.o)
SOURCE = heroes.c
EXECUTABLE = $(SOURCE:.c=.exe)

ifeq ($(OS), Windows_NT)
	RM = rm -rf
else
	RM = rm -rf
endif

$(EXECUTABLE): $(JSONIC_OBJ)
	$(CC) -o $@ $(SOURCE) $< $(CFLAGS)

clean:
	$(RM) $(EXECUTABLE)
We are going to add a debug recipe to our Makefile:
debug: $(EXECUTABLE)
	@curl http://127.0.0.1:5550/api/runtime/run
Finally the Makefile will look like this:
CC = gcc
CFLAGS = -std=c99 -I../../ -O3 -g
JSONIC_SOURCES = $(filter-out $(shell find ../../ -path "*/examples/*"), $(shell find ../../ -name "*.c"))
JSONIC_HEADERS = $(filter-out $(shell find ../../ -path "*/examples/*"), $(shell find ../../ -name "*.h"))
JSONIC_OBJ = $(JSONIC_SOURCES:.c=.o)
SOURCE = heroes.c
EXECUTABLE = $(SOURCE:.c=.exe)

ifeq ($(OS), Windows_NT)
	RM = rm -rf
else
	RM = rm -rf
endif

$(EXECUTABLE): $(JSONIC_OBJ)
	$(CC) -o $@ $(SOURCE) $< $(CFLAGS)

clean:
	$(RM) $(EXECUTABLE)

debug: $(EXECUTABLE)
	@curl http://127.0.0.1:5550/api/runtime/run
Let’s use our debug recipe
We added a debug recipe into the Makefile. Now we can use it like this:
make clean; make debugThis will build your application and start your application on GDBFrontend.
Getting a variable for a specific testing
For an example to special debugger integration requirements, let’s see this example.
Don’t forget to apply URL encoding:
For example sending a parameter:
http://127.0.0.1:5550/api/frame/variable?expression="jsonic_object_get(json_string, root, "squadName")->val"Should be like this:
http://127.0.0.1:5550/api/frame/variable?expression="jsonic_object_get(json_string%2C%20root%2C%20%22squadName%22)-%3Eval"Just add this to the Makefile recipe:
debug: $(EXECUTABLE)
	@curl http://127.0.0.1:5550/api/runtime/run
	$(info Waiting debugger to interrupt...)
	@sleep 5
	$(info Value for expression: "jsonic_object_get(json_string, root, "squadName")->val")
	@eval echo "$$(curl http://127.0.0.1:5550/api/frame/variable?expression="jsonic_object_get(json_string%2C%20root%2C%20%22squadName%22)-%3Eval")"
You will an output like this:
root@milkyway:/mnt/c/proje/jsonic/examples/heroes# make debug
Waiting debugger to interrupt...
Value for expression: "jsonic_object_get(json_string, root, "squadName")->val"
{"ok": true}{ok: true, variable: {is_global: false, name: val, expression: jsonic_object_get(json_string, root, "squadName")->val, is_pointer: true, is_optimized_out: false, address: 0x55555555ac78, value: Super "hero" squad, is_nts: true, type: {alignof: 8, code: 1, name: null, sizeof: 8, tag: null, is_pointer: true, terminal: {alignof: 1, code: 8, name: char, sizeof: 1, tag: null, is_pointer: false}}, type_tree: [{alignof: 8, code: 1, name: null, sizeof: 8, tag: null, is_pointer: true}, {alignof: 1, code: 8, name: char, sizeof: 1, tag: null, is_pointer: false}], members: []}}
root@milkyway:/mnt/c/proje/jsonic/examples/heroes#
Important! You may be noticed that we’ve added
sleep 5to wait the debugger to start and interrupt application. This is a bad approach of course, you can write your own script and use GDBFrontend’s WebSocket API to listen events likestopevent and do your jobs on events.
What now?
Possibilities are infinite. You can follow Plugin Development Tutorial to make your own complex integrations.
By writing your own GDBFrontend plugin, you can make your own Python, HTTP and WebSocket APIs and you can communicate to them from other platforms.
Some ideas for integrations
For special development and debuggin requirements you can do something like these with your own plugin:
- Restarting debugging
- Adding breakpoints
- Writing your own GDBFrontendd plugin to use it for special debugging requirements and integrations
- Writing your own WebSocket client to listen debugging events
- Spawning an evaluater window
- Make your own custom data visualizer and trigger them from your integrations
- Using terminal API for special requirements
Happy debugging! ❤️